When it comes to futures trading, the difference between a winning trade and a losing one often comes down to identifying true supply and demand imbalances. It is not just about reacting to price movement; it is about understanding the story the candles are telling you.
In this trading breakdown, M...
The Great Equalizer: How Retail Traders Can Beat Wall Street at Their Own Game
Most people believe that the major players on Wall Street hold an insurmountable edge over the average retail trader. And let’s be honest—they do. They have the capital, the algorithms, and the speed. But you don't have ...
5 Trading Mantras to Build a Consistent Personal Portfolio
I’ve been trading the markets for over 15 years, growing a personal portfolio from near-depletion to a successful level and achieving multiple funded accounts along the way. Securing financial freedom through trading is possible, but it req...
What if the bearish case everyone is worried about in the market is real… but it’s still not the whole story?
That’s the question I’ve been thinking about after reading a recent MarketWatch opinion piece by Lawrence G. McMillan. If you’ve been around trading for a while, you probably know McMillan’...
A Live British Pound Futures (6B) Short Breakdown
Most trading content you see online is hindsight trading.
Charts are cleaned up.
Entries look perfect.
Exits seem obvious.
But real trading doesn’t work like that.
In this breakdown, you’ll see a live short trade on the British Pound future...
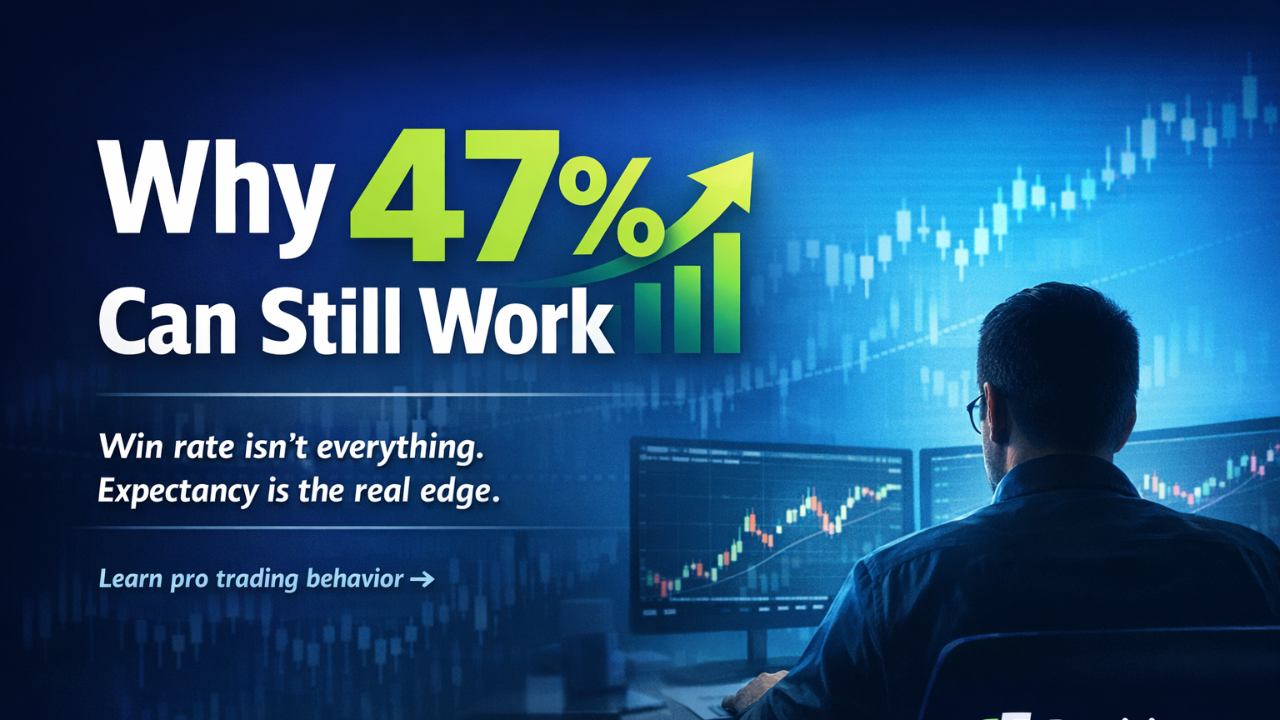
Why 47% Can Still Work
A trader can lose more than half their trades and still be profitable if:
- The average winner is larger than the average lose
- Risk remains consistent
- Behavior does not deteriorate after losses
Most retail traders fail evaluations not because they lack knowledge.
They ...
Why Risk Management Is the Real Edge in ES Futures Trading
Effective risk management is what separates trading from gambling. Without a clear plan for entries, exits, and timing, even the best setups can fail. In this tutorial, we break down the mechanics of executing a precision 2:1 futures trade ...
Stop Guessing Market Direction: Turn Headlines into High-Probability Trades with Supply & Demand Zones
Tired of staring at charts wondering which way the market will break? Stop chasing hunches and start trading like institutions do—by spotting their "footprints" in price action.In our latest vide...
Why Most Trading Videos Fail You (And What Real Trade Planning Looks Like)
Most YouTube traders show you what *would have* worked—after the move is already over. That’s not trading. That’s hindsight.
In this video, we do the exact opposite. You’ll see a live trade plan on the Micro S&P 500 (MES) b...
How Professional Traders Stay Consistent Without Lagging Indicators
Consistency in trading doesn’t come from chasing moving averages or relying on lagging indicators—it comes from understanding Supply and Demand. In a recent breakdown, Mitch Firestone of Precision Trading Labs shows how professiona...
Why Your Trades Are Failing (And How to Fix It with MES Supply & Demand)
Most traders struggle because they react to the market instead of planning for it. Precision Trading Labs shows a better way: patient, rule-based trading using Micro S&P 500 (MES) futures.
In a recent trade, Mitch Firestone u...
How Professional Traders Structure Low-Risk MES Futures Trades
Want to know how professional traders approach low-risk E-mini S&P (MES) futures trades? In a recent breakdown from Mitch Firestone of Precision Trading Labs, we get an inside look at a real ES futures trade executed with precision and ...
